Actionable Revenue Cycle Analytics
Rivet Revenue Diagnostics immediately improves your revenue cycle performance with detailed, flexible, and real-time dashboards. No digging required.
Problem icon

The Problem

Revenue reporting can waste hours of time searching, compiling and re-checking data. The tools from your clearinghouse and EMR only do half the job - and their reports can differ, making results untrustworthy. In addition, most reports are made at a stagnant point in time and not up to date when you need them, creating more work and wasted time.


Solution icon

The Solution

Rivet Revenue Diagnostics offers customizable and filterable views of your data in visually dashboards - showcasing what you want to see - whenever you need it (now). With data-driven insights you can achieve sustainable revenue growth and thrive in the ever-changing landscape of healthcare finance. Dive in and drill into real-time reports to get the answers you need to build the business you want.

Asset 17@x-3
What must-have data insights are needed for healthcare finance leaders?

Healthcare finance leaders are looking for insights and trends regarding revenue, denials, A/R, and insurance payers. Typically they make the most of their typical tools and reports, but most are made for a stagnant point in time and not as a real-time data analyzer. Until now.

That’s where Rivet Revenue Diagnostics shines: Without even a moment’s hesitation, Rivet analyzes and interprets claim data in a single click. Visualize reimbursement trends and growth opportunities in seconds and can be downloaded for stakeholders at any time.


Take immediate action to improve your revenue cycle performance with Rivet’s key detailed, flexible dashboard reports.


Artboard 6-3

Rivet Revenue Report

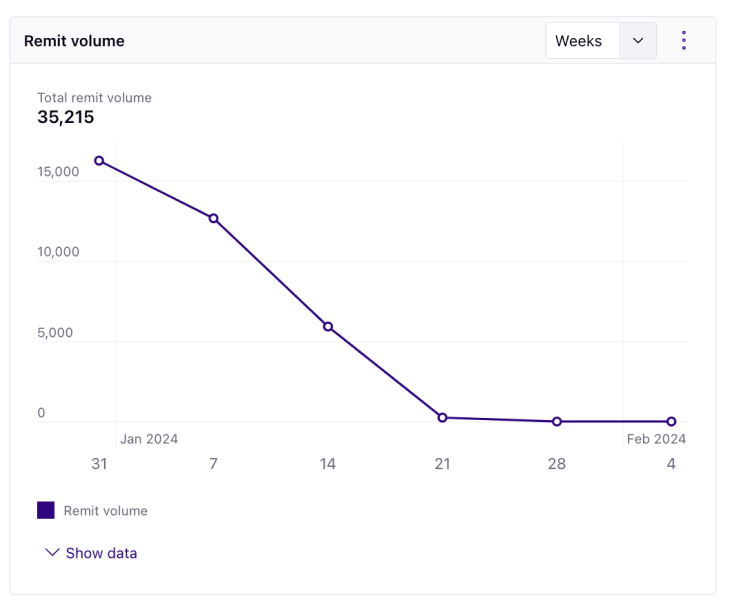
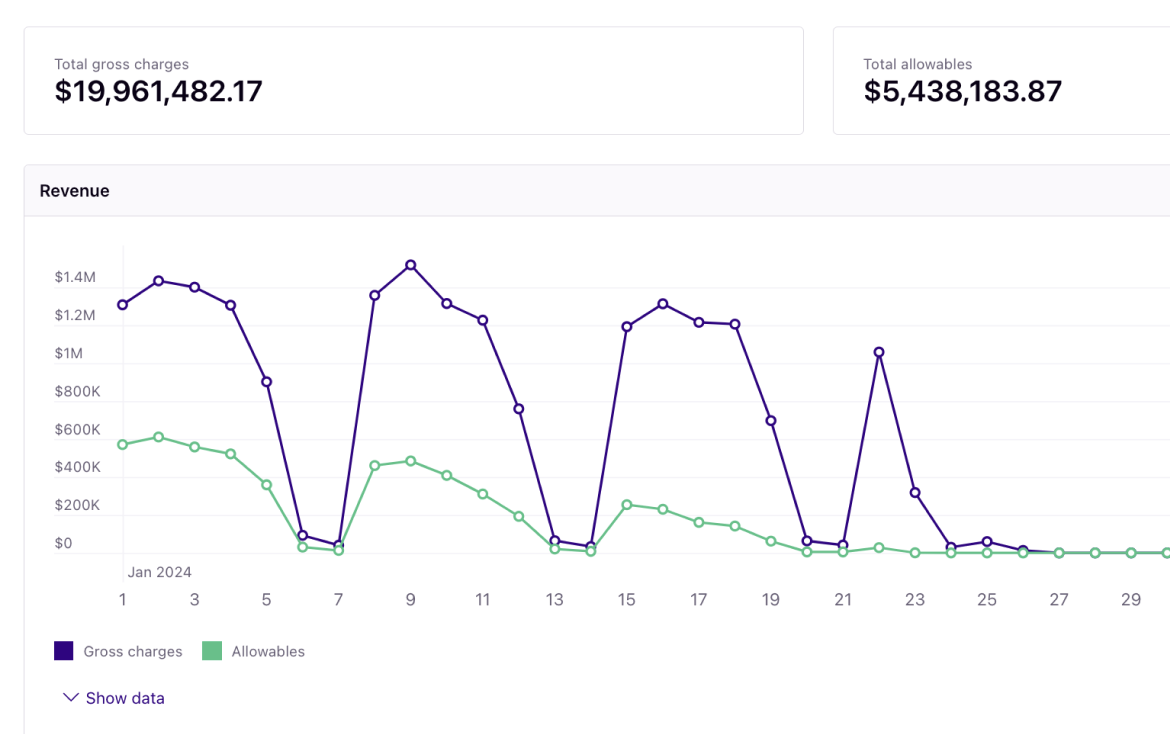
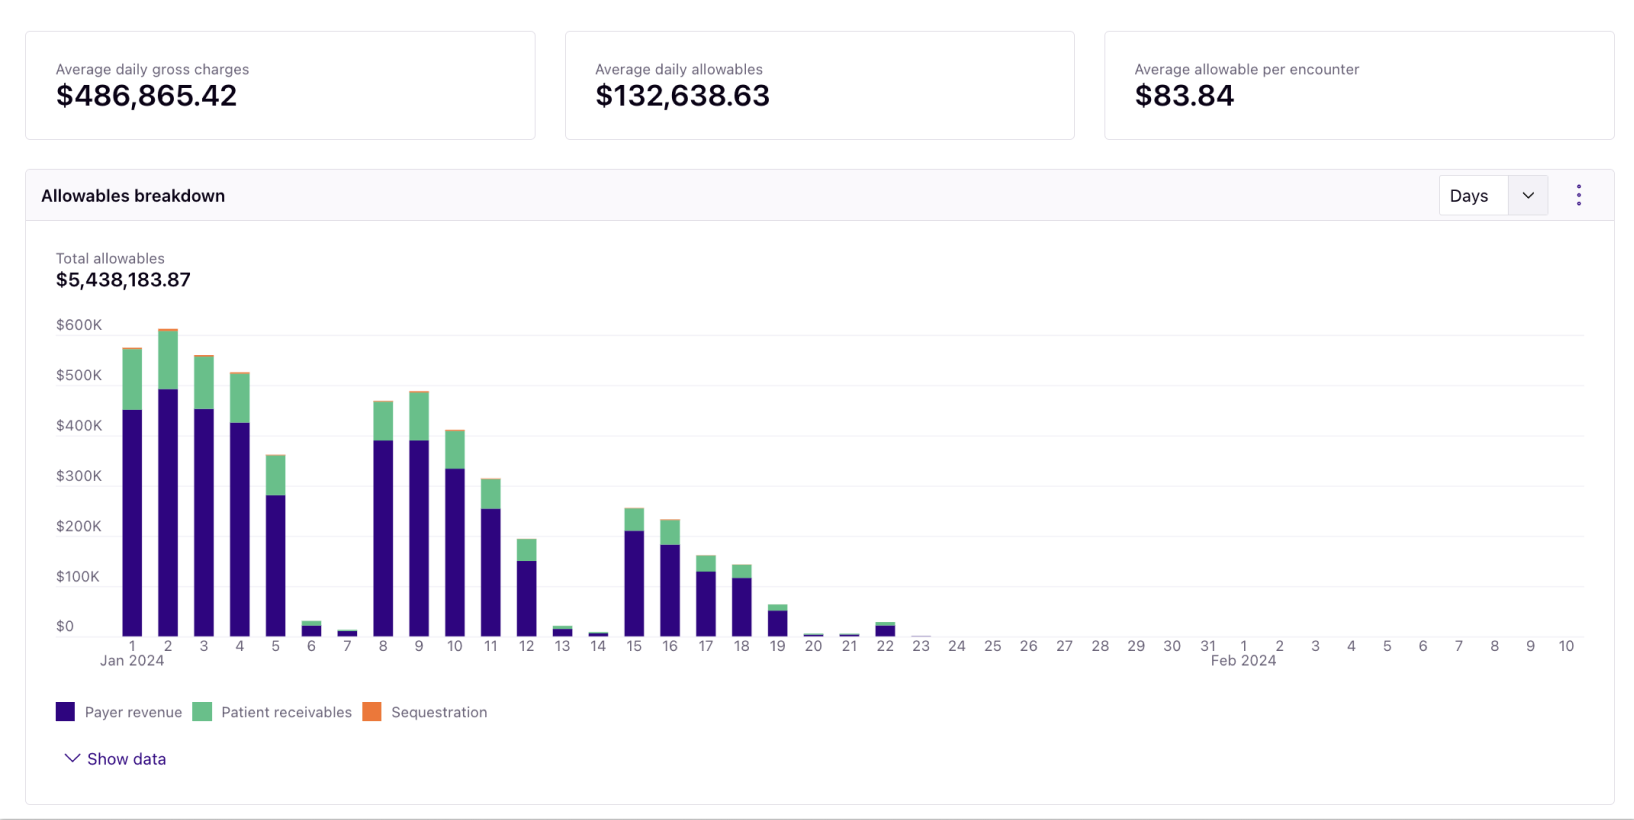
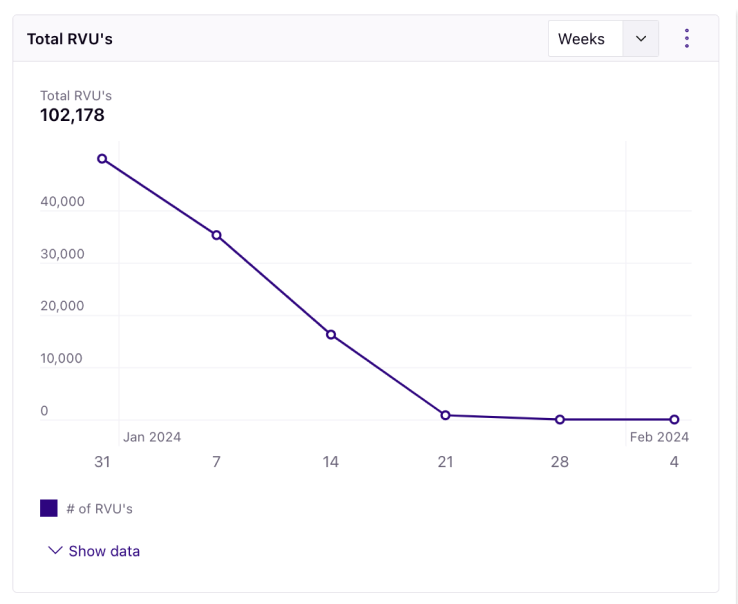
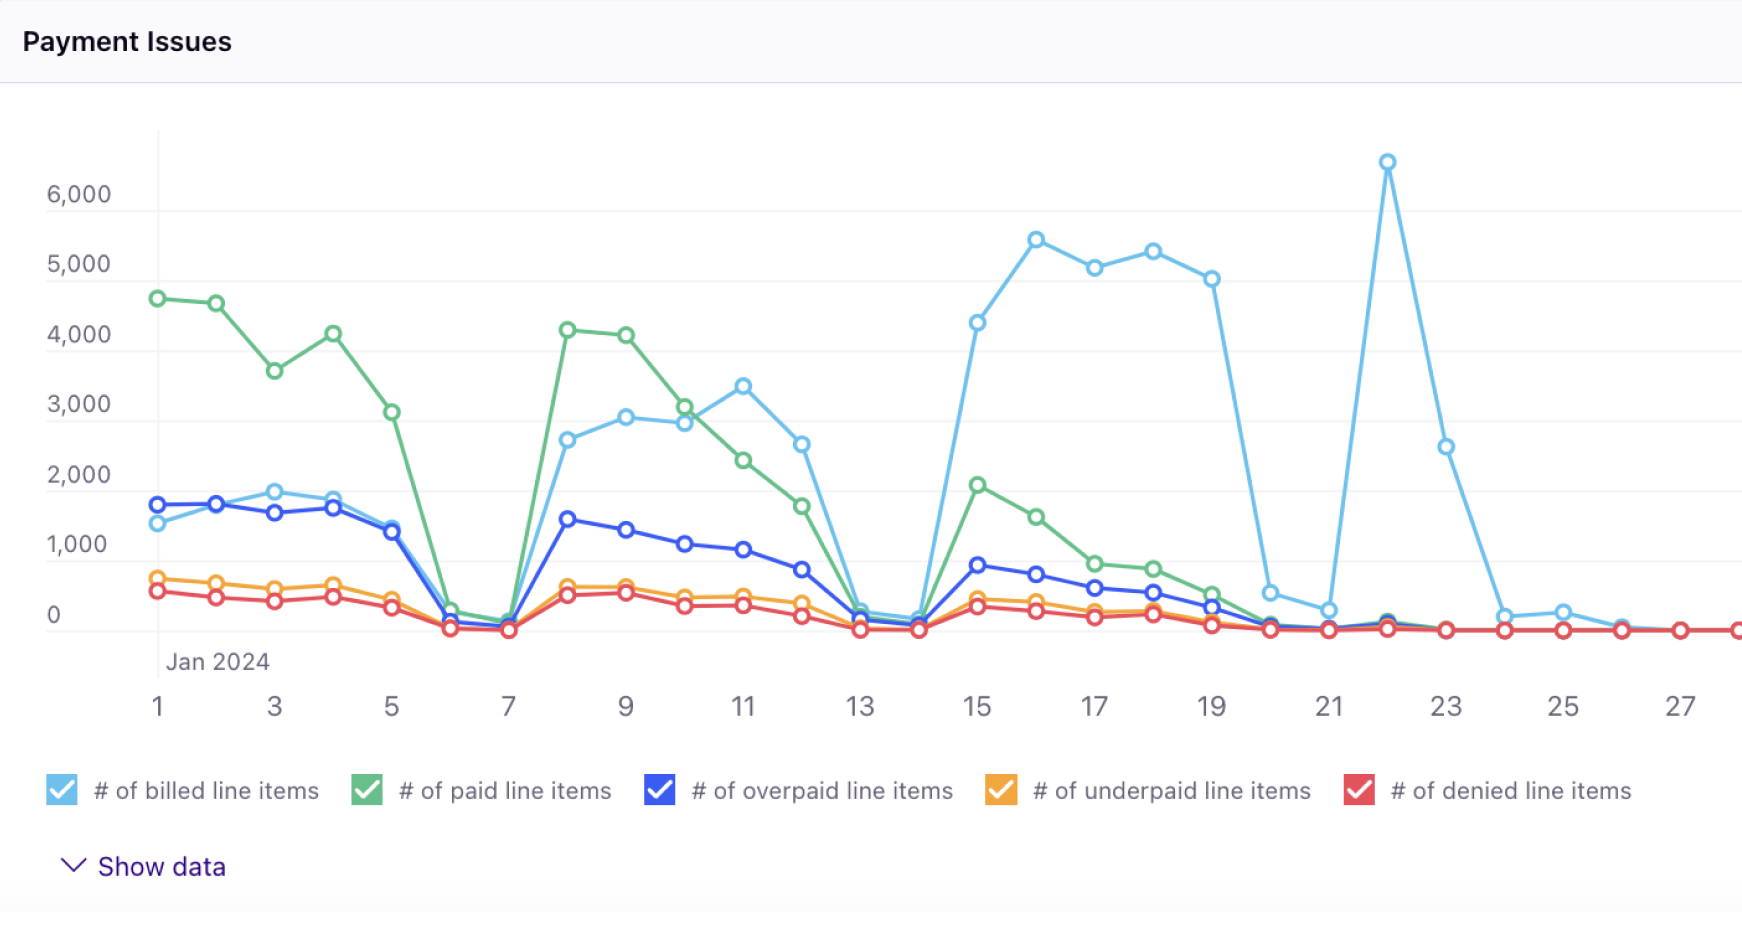
The Rivet Revenue Report allows you to analyze where your revenue derives from — drill down into allowables, gross charges and collection rates, payment issues, remit volumes, and recovery rates.

These overall metrics allow for the best overall reporting to the C-suite and allow for the best starting point for most, if not all, strategic initiatives to promote revenue maximization. Manage your revenue using these charts:

Screenshot 2024-07-11 at 12.38.04 PM

Analyze your revenue
Screenshot 2024-07-24 at 10.49.26 AM

Gross charges vs. allowables

  • Compare gross charges with total allowables.
  • Notice if your charge prices are too low for your allowables or if gross charges far surpass allowables.
Screenshot 2024-07-24 at 10.49.26 AM
Screenshot 2024-07-24 at 10.48.11 AM

Payer vs. patient revenue

  • Break down how you’re being paid — overall averages at the top and then payment is segmented into payers, patients, and sequestration.
  • Easily show the bulk of reimbursement or how much is received from payers versus patients.
Screenshot 2024-07-24 at 10.48.11 AM
Screenshot 2024-07-11 at 12.38.22 PM

Remit volume + RVUs

  • Measure remit volume and total RVUs.
  • See if the volume of claims that need multiple touch points is a red flag and easily capture productivity metrics for provider reimbursement.
Screenshot 2024-07-11 at 12.38.22 PM
Screenshot 2024-07-11 at 12.38.04 PM

Gross collection rate

  • Determine how much of your gross collection you are capturing over time.
  • This is the starting point for why collection has shifted over a period of time.
Screenshot 2024-07-11 at 12.38.04 PM
Screenshot 2024-07-24 at 10.46.55 AM

Payment issues

  • Compare payment issues against the number of billed line items and the number of paid line items.
  • Easily determine where to spend time training or retraining staff to reduce errors and maximize revenue.
Screenshot 2024-07-24 at 10.46.55 AM

Artboard 6 copy-Aug-08-2024-09-49-25-1471-PM

Denial Performance Report

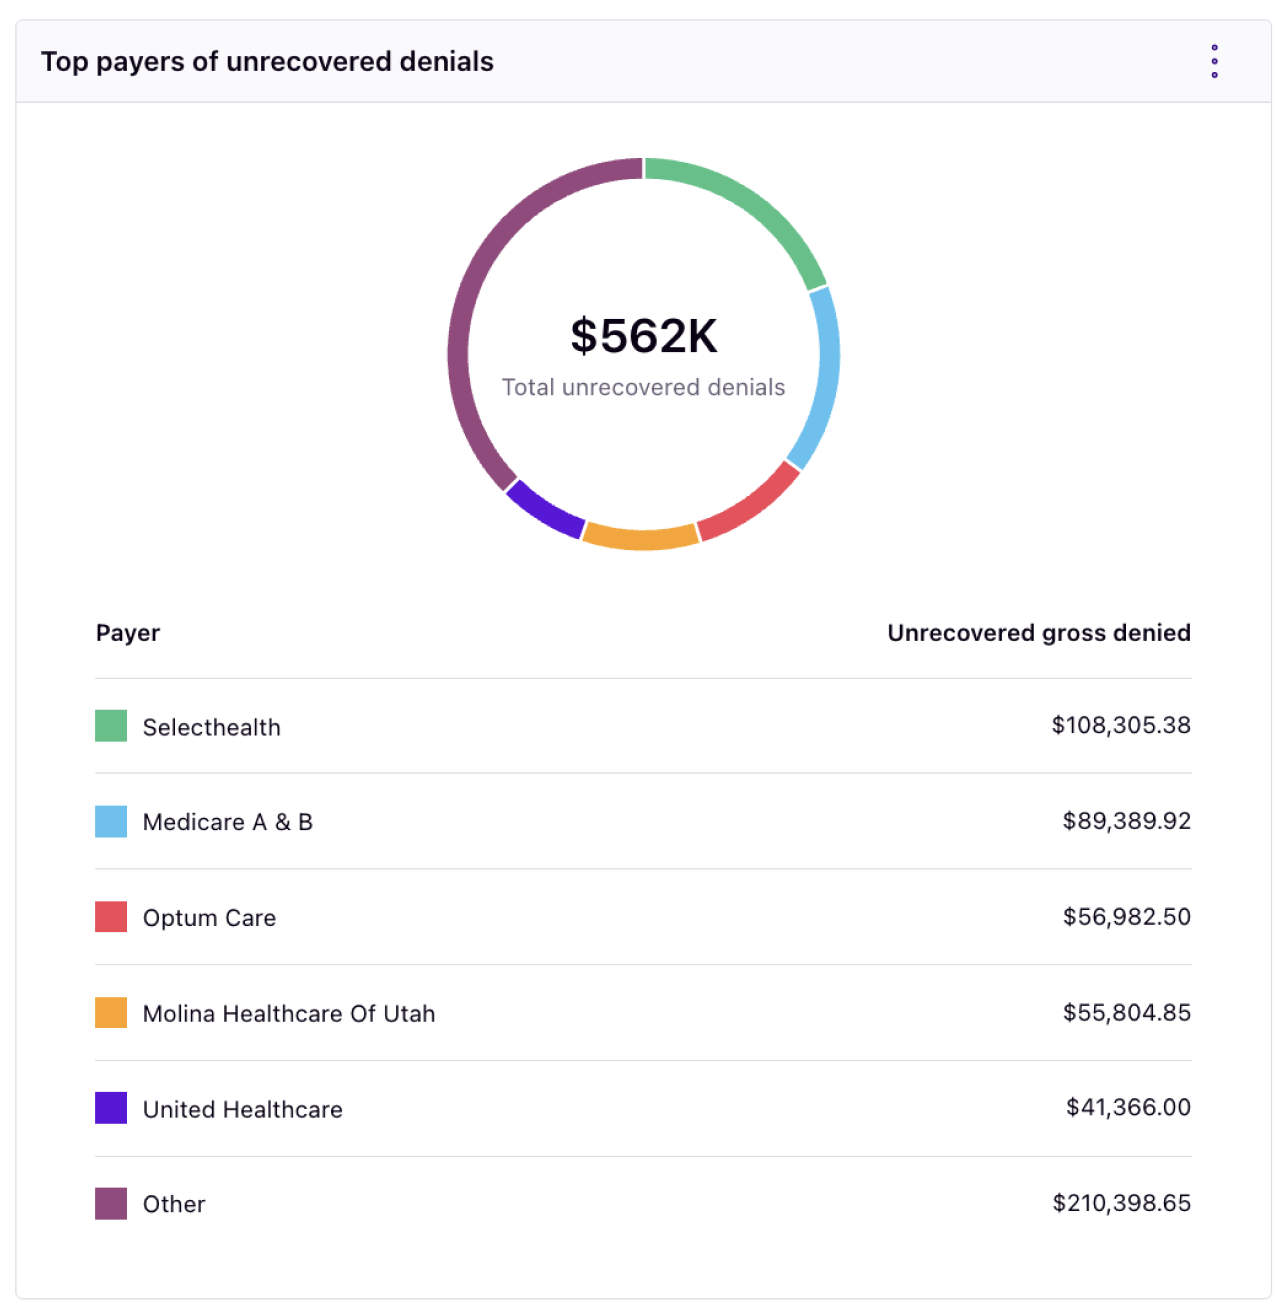
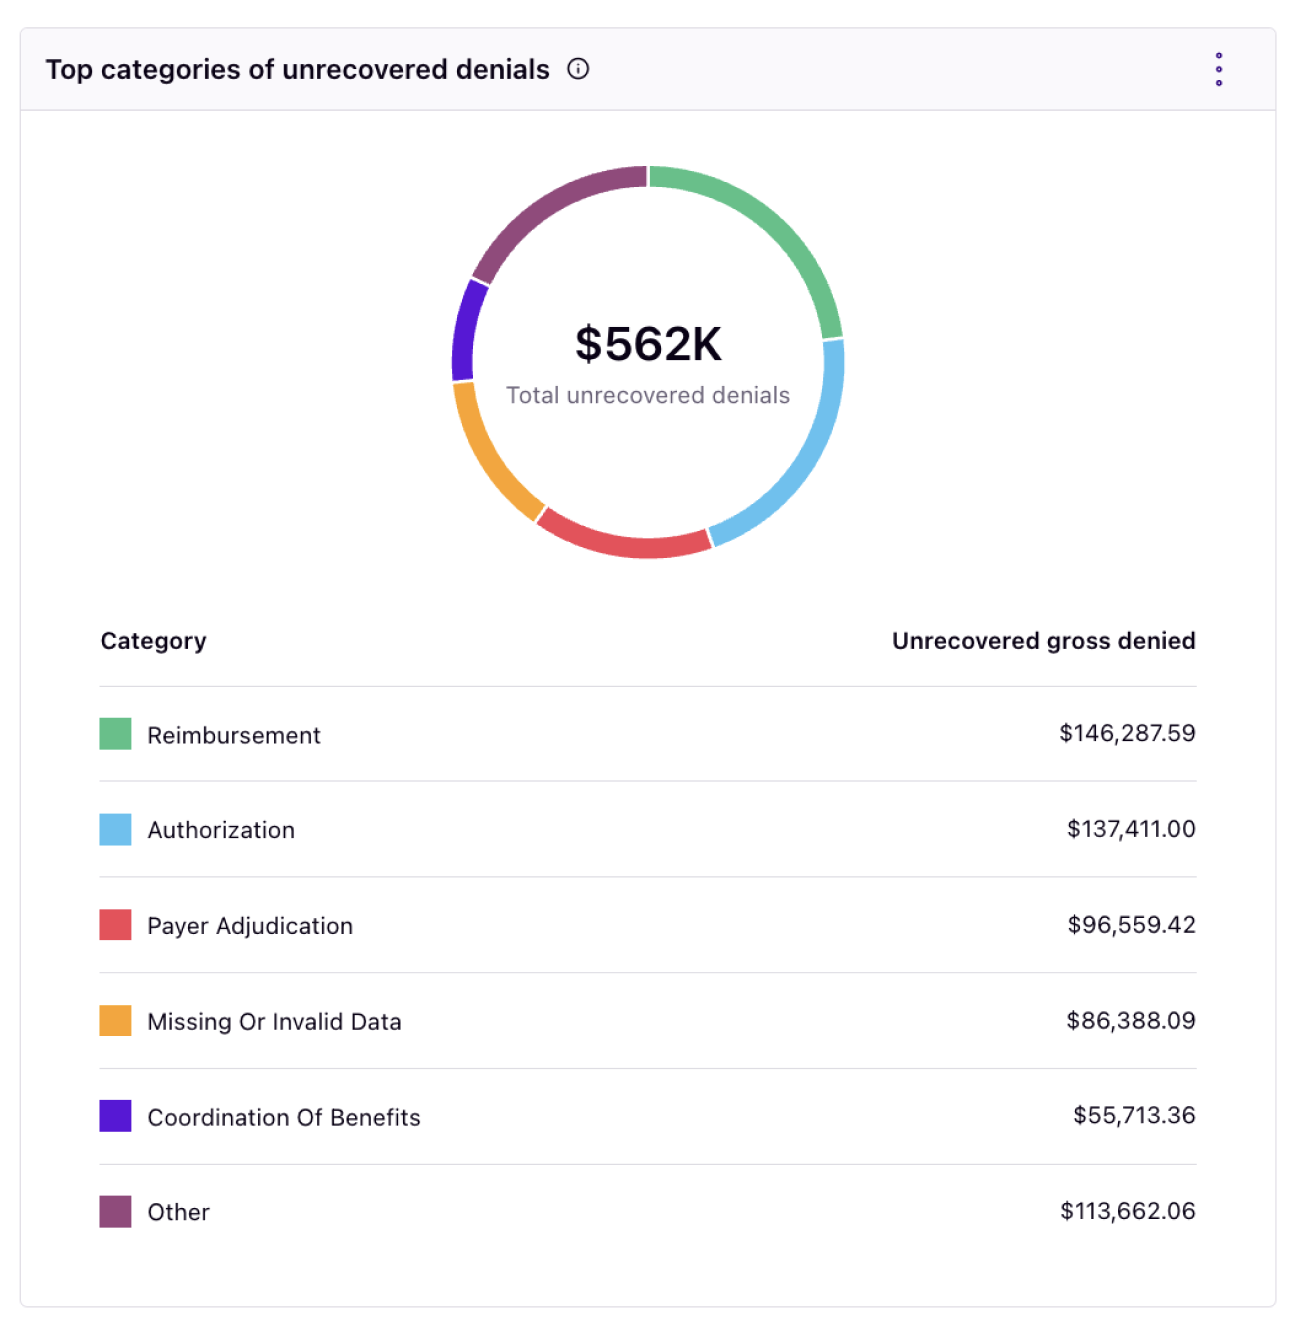
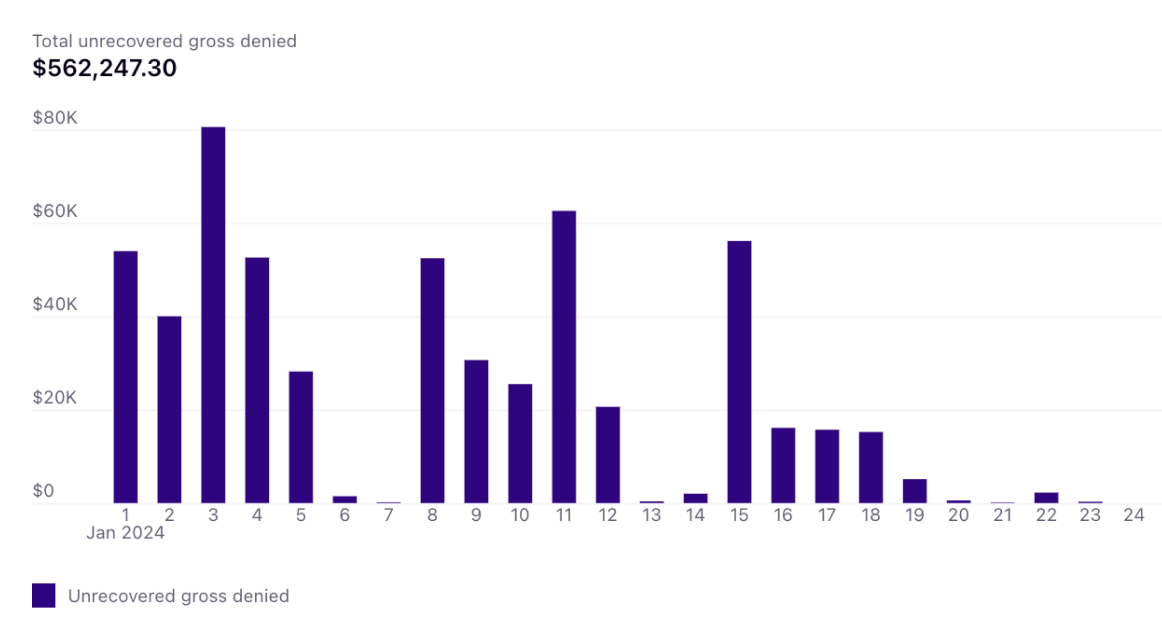
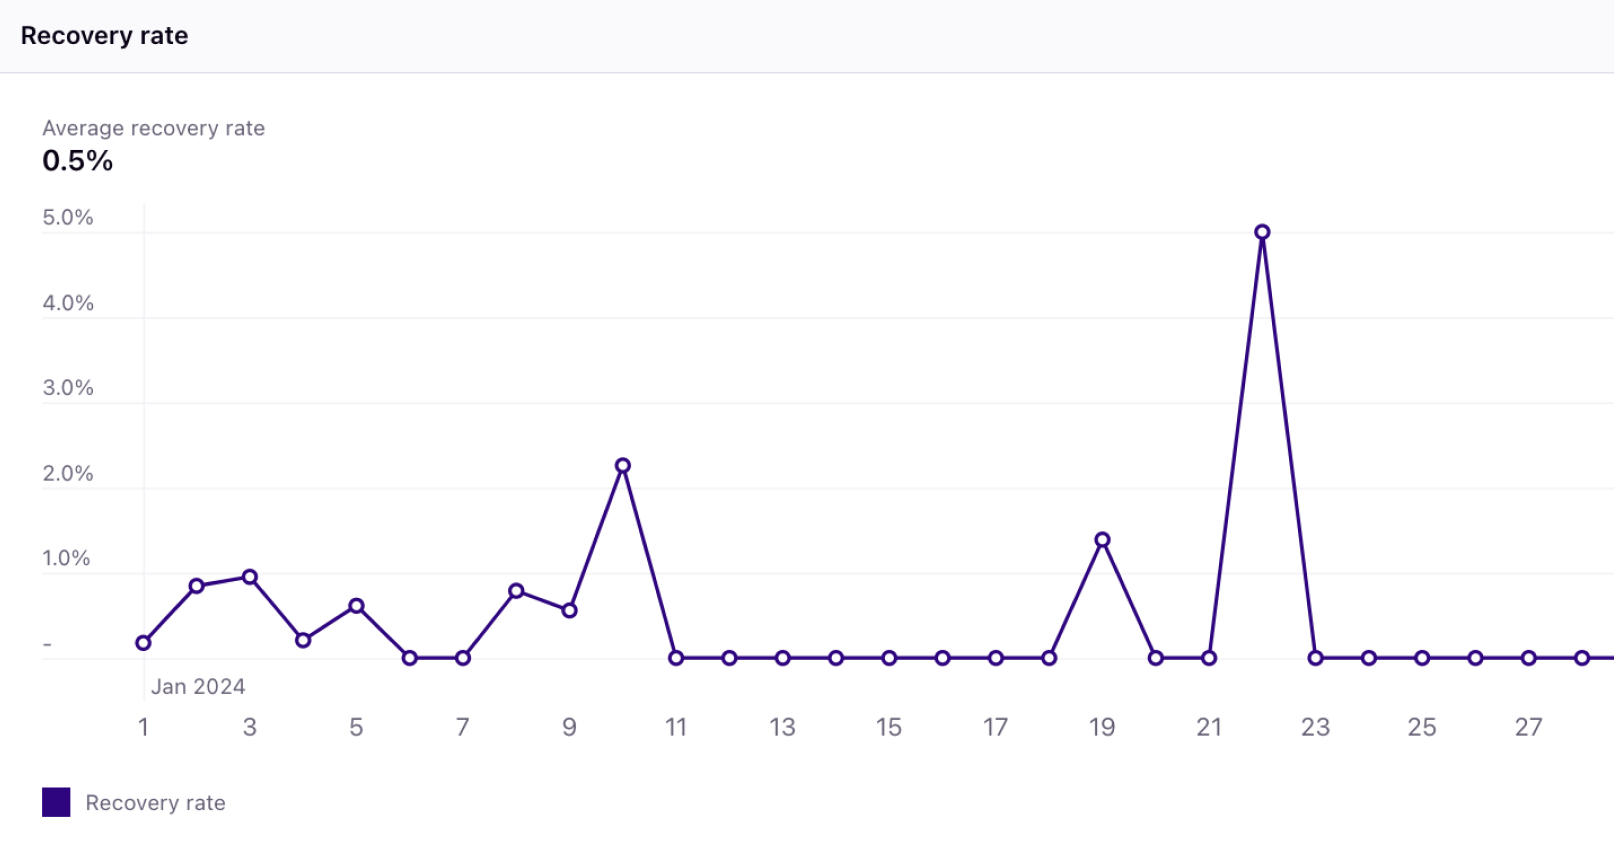
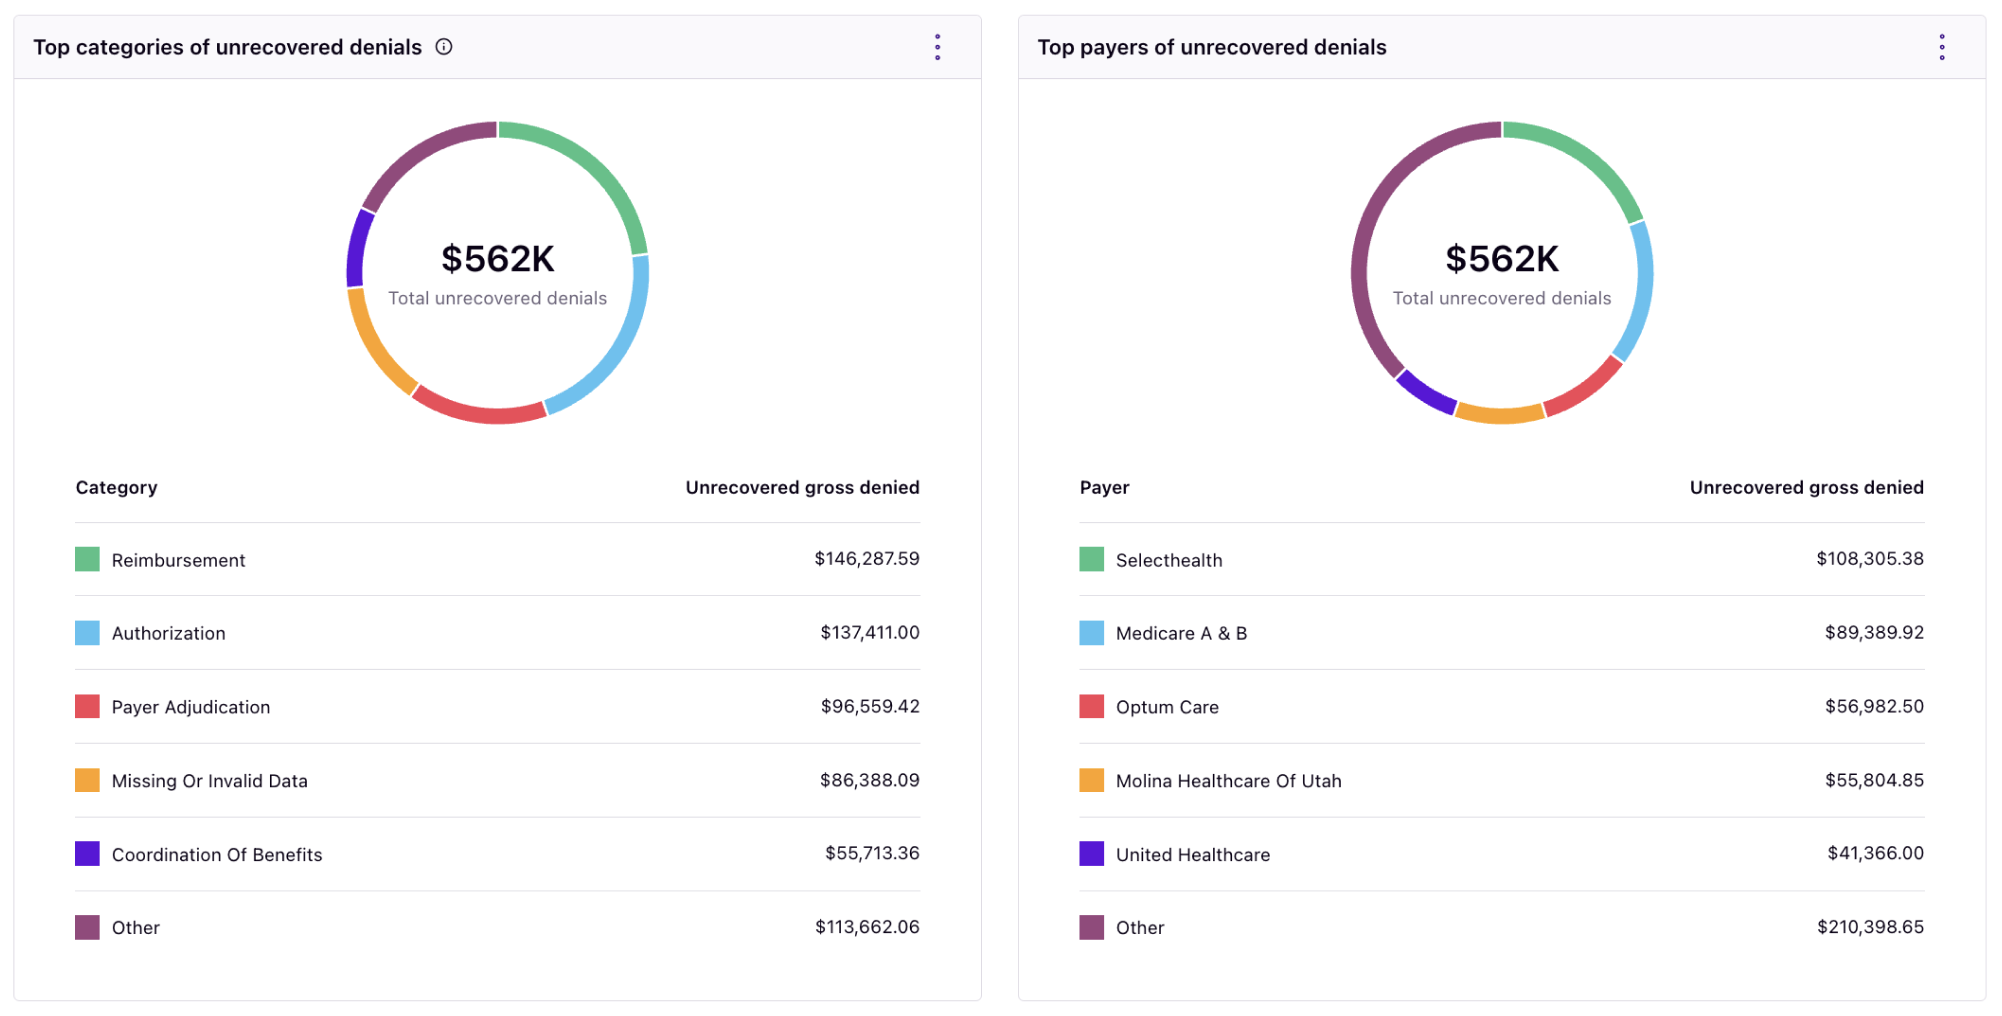
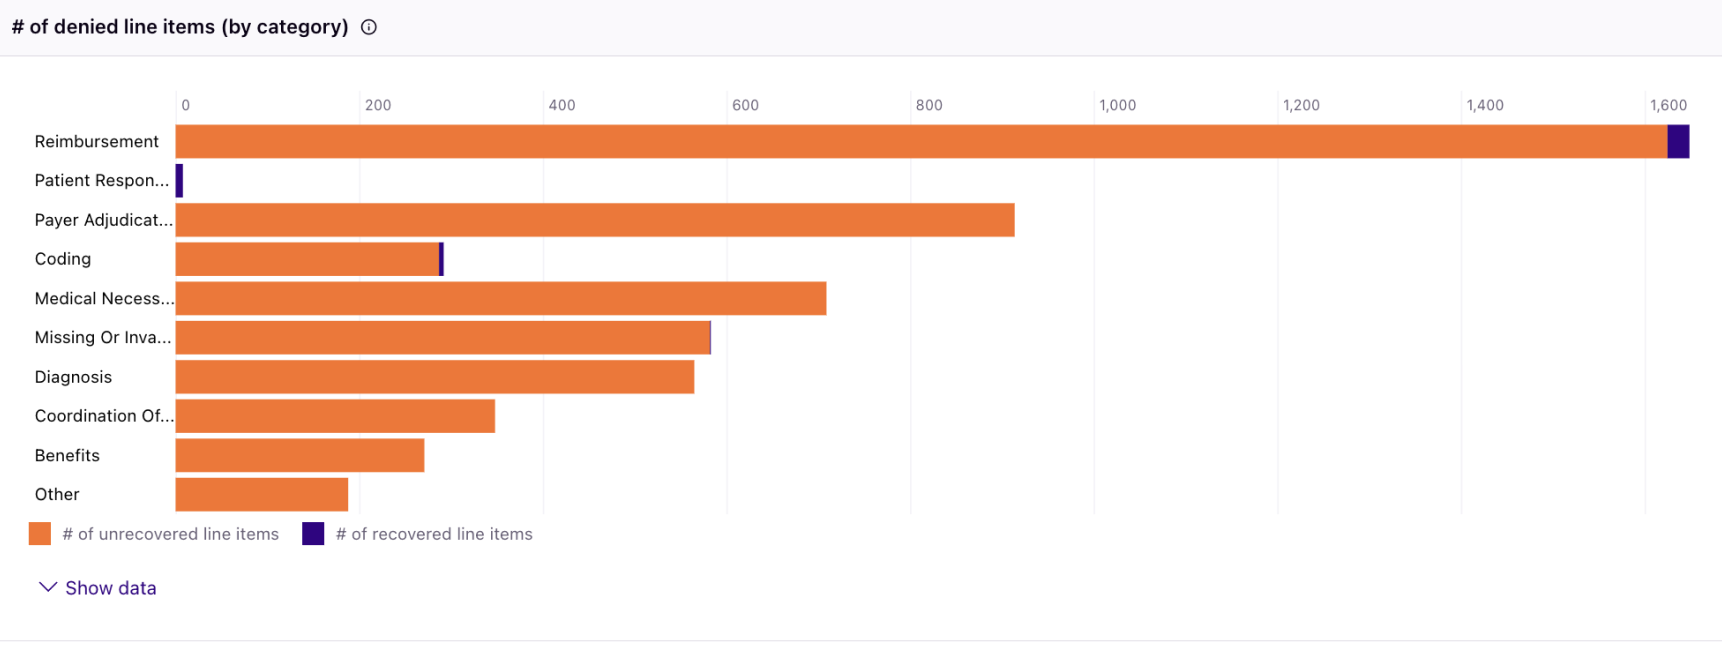
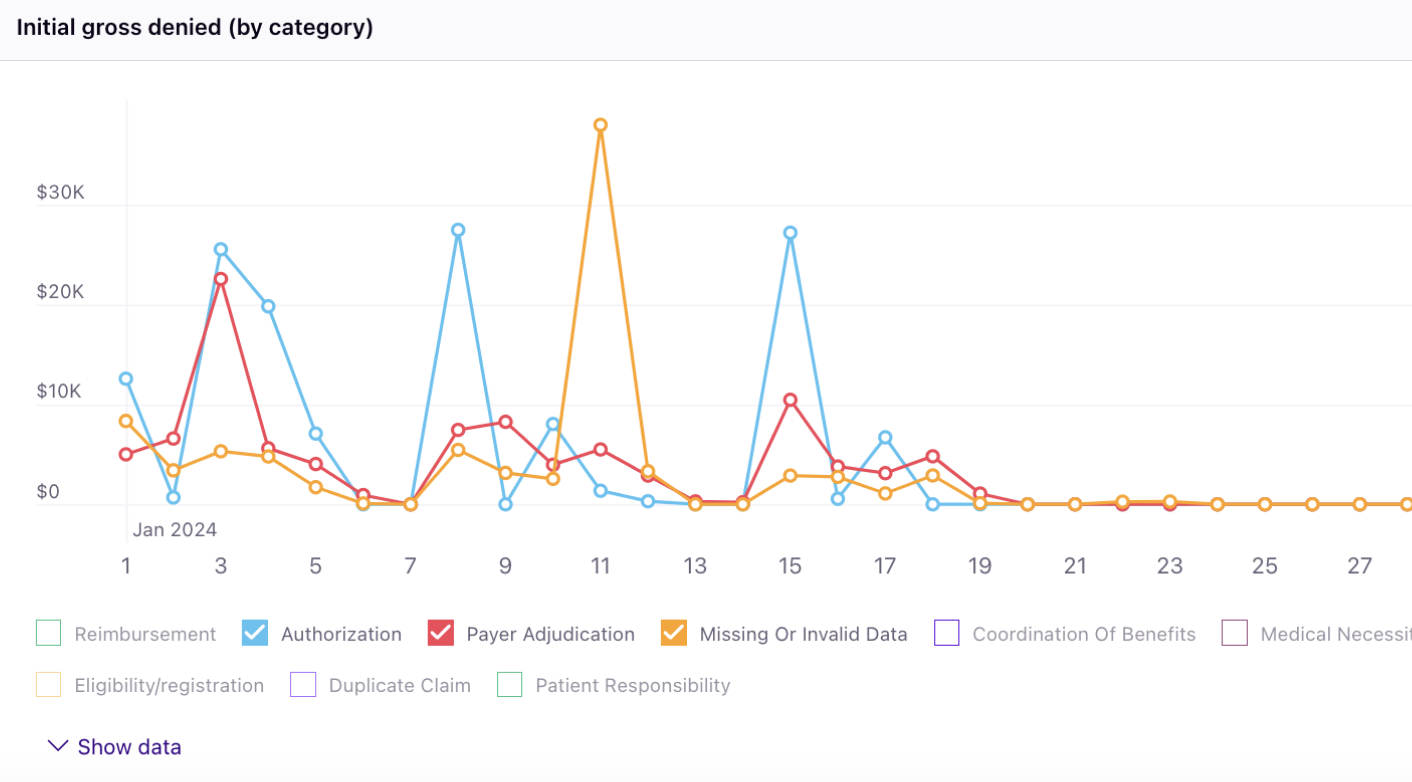
The Rivet Denial Performance Report allows you to deeply understand your initial denial rate, total initial gross denied, average recovery rate, and unrecovered gross denied charges.

Make changes in your coding, billing, and patient access teams to enhance initial clean claim rates and realize more revenue. Initiate change in your denials workflow using these charts:

Screenshot 2024-07-15 at 12.18.36 PM-1
Strategize revenue recovery
Screenshot 2024-07-15 at 11.30.57 AM

Unrecovered gross denials

  • Overall metrics for denied claims and unrealized revenue.
  • Easily capture current status of denied claim rates and totals to initiate changes to one or more of these metrics.
Screenshot 2024-07-15 at 11.30.57 AM
Screenshot 2024-07-15 at 11.41.42 AM

Recovery rate

  • Watch how your average recovery rate has changed over a given period of time.
  • Determine what time period needs further analysis to reinforce positive change or stop negative change.
Screenshot 2024-07-15 at 11.41.42 AM
Screenshot 2024-08-08 at 5.26.48 PM

Top categories + payer of unrecovered denials

  • Easily view your top denial reasons and payers supplying the denials.
  • Start investing in training for a specific denial type or create a denial project based on a specific payer.
Screenshot 2024-08-08 at 5.26.48 PM
Screenshot 2024-07-15 at 1.15.08 PM

Unrecovered lines

  • In a quick glance, keep track of revenue outstanding and recovered by denial type.
  • Notice which denial type is consistently missing reimbursement and where training or procedural changes need to take place.
Screenshot 2024-07-15 at 1.15.08 PM
Screenshot 2024-07-15 at 1.31.27 PM-1

Initial gross denials

  • Visualize and compare your top denial types over a given period of time.
  • Report on denial changes and how large one issue is over others.
Screenshot 2024-07-15 at 1.31.27 PM-1

Artboard 6 copy 2-1

Rivet A/R Performance Report

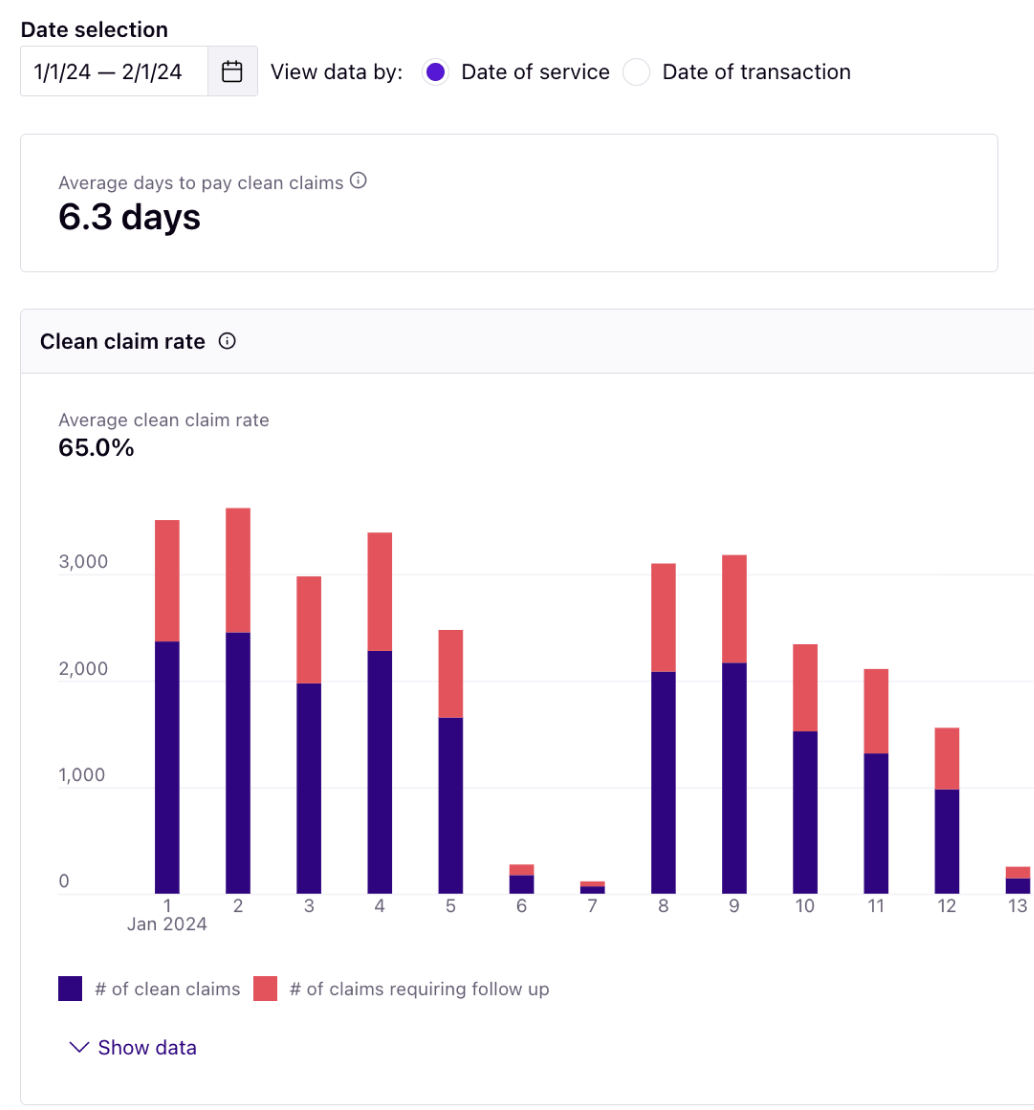
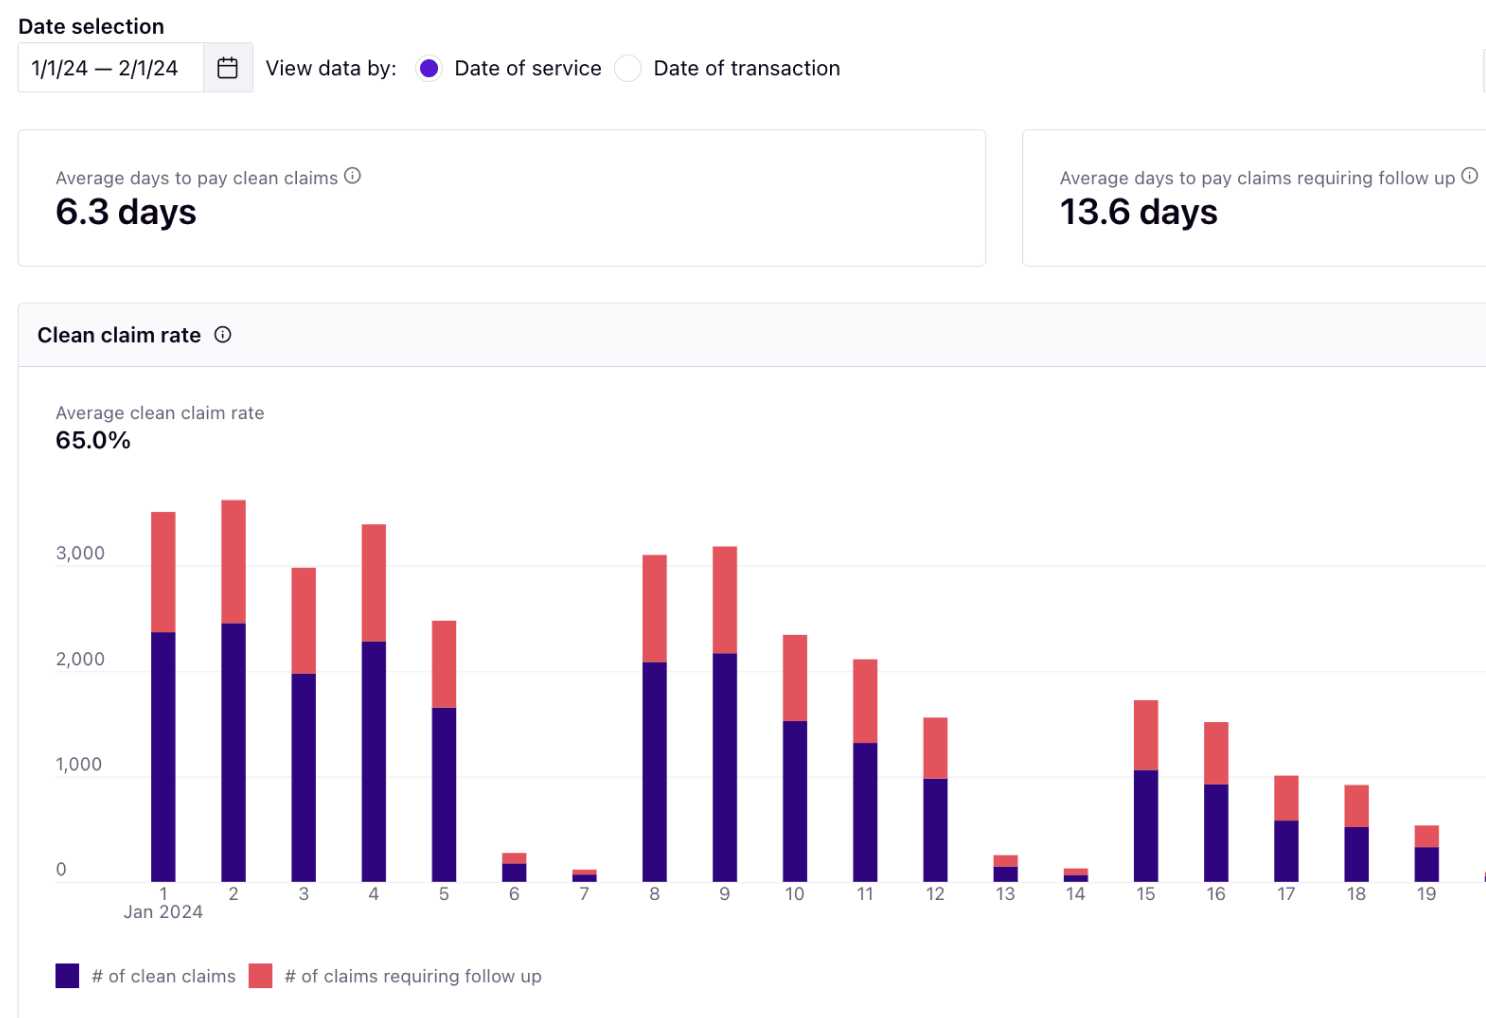
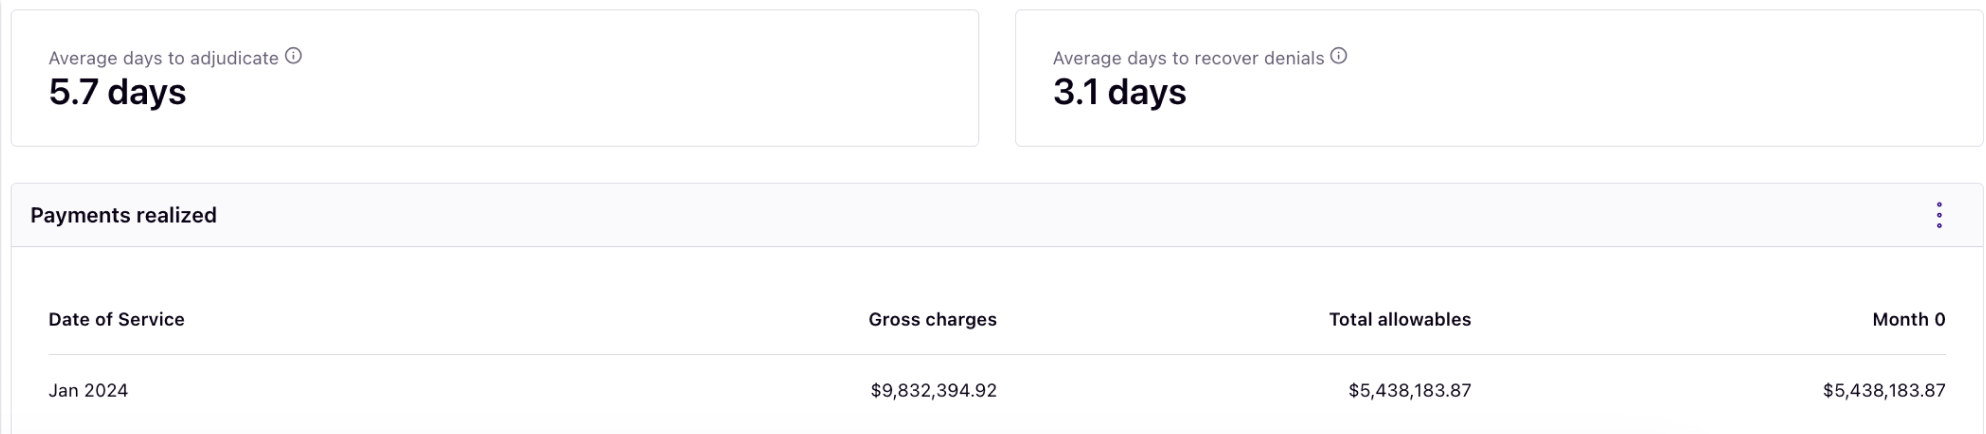
The Rivet A/R Performance Report allows you to constantly review your clean claim rate and average days to pay claims, adjudicate claims, and recover denials.

Use this data to enhance training efforts and plan strategic initiatives involving prepayment, prior authorization, coding, etc. Enhance strategic initiatives using these charts:

Screenshot 2024-08-08 at 4.41.00 PM
Enhance your strategic initiatives
Screenshot 2024-08-08 at 5.30.14 PM

Clean claim rate

  • Overall averages for days to pay clean claims and those requiring follow up.
  • Focus strategic plans with ongoing metrics to prove trends leading to decrease of days to pay and increased clean claim rate.
Screenshot 2024-08-08 at 5.30.14 PM
Screenshot 2024-08-08 at 5.31.51 PM

Payments realized

  • Review the average days to adjudicate claims and average days to recover denials.
  • Keep tabs on variables that are in and out of your control and enhance staff training to improve overall performance.
Screenshot 2024-08-08 at 5.31.51 PM

Artboard 6 copy 3-1

Rivet Payers Report

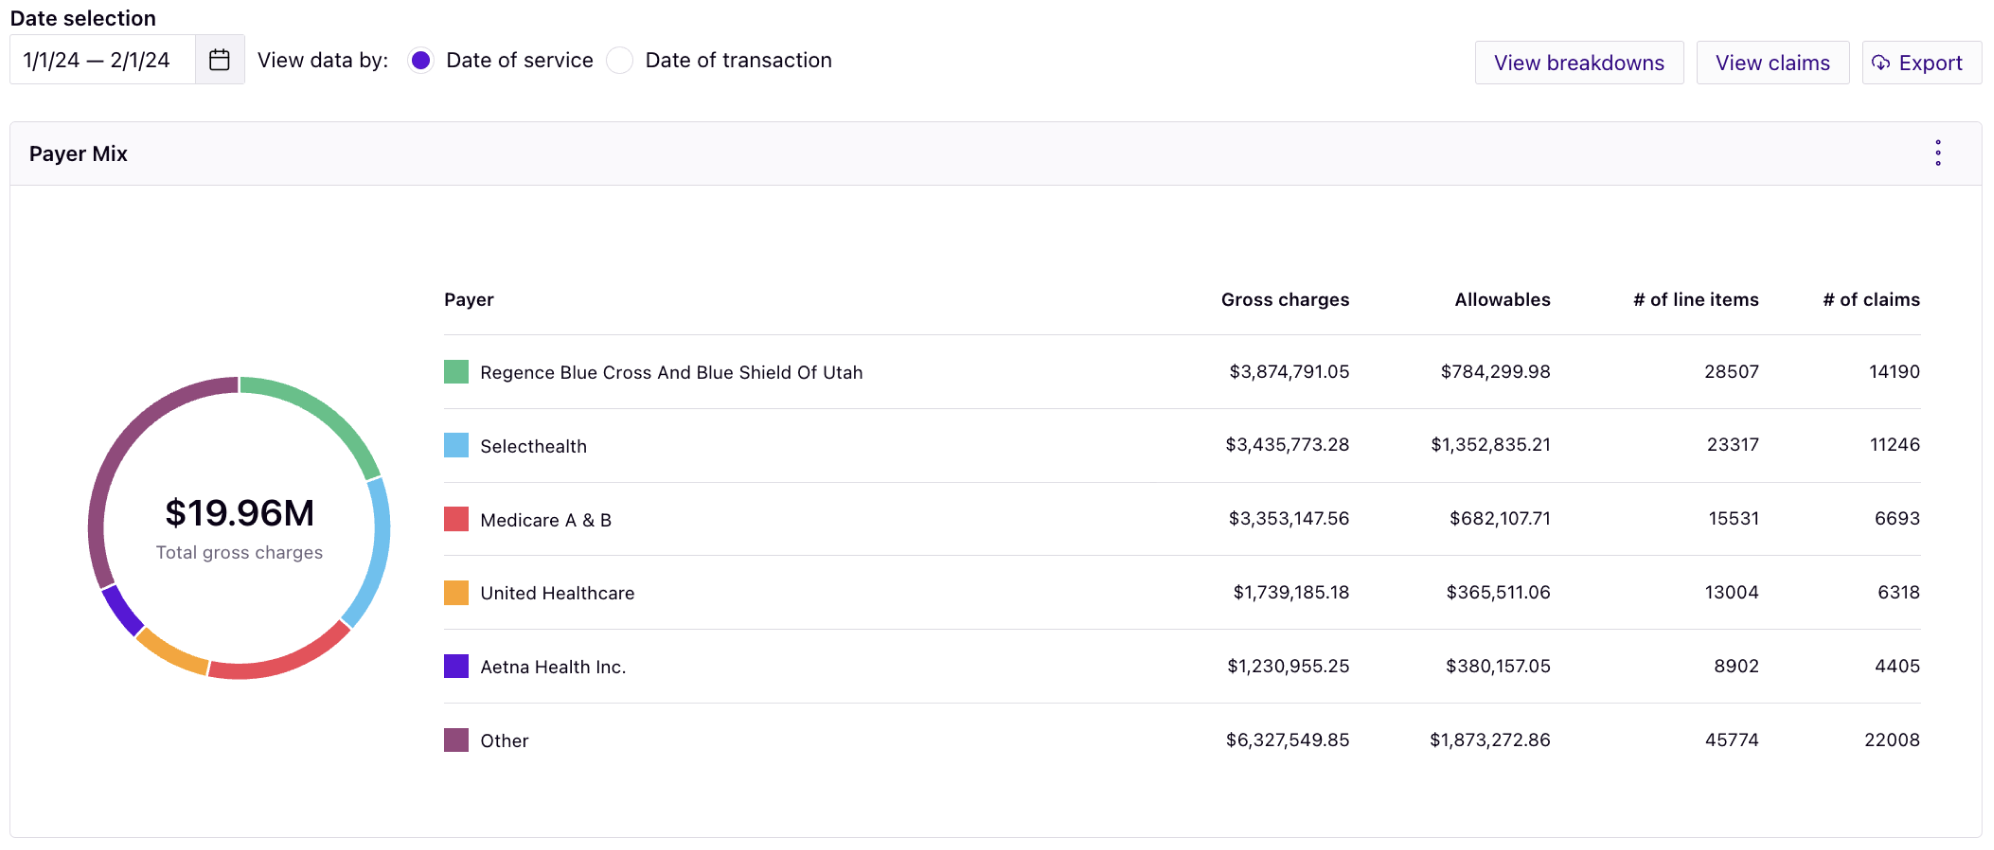
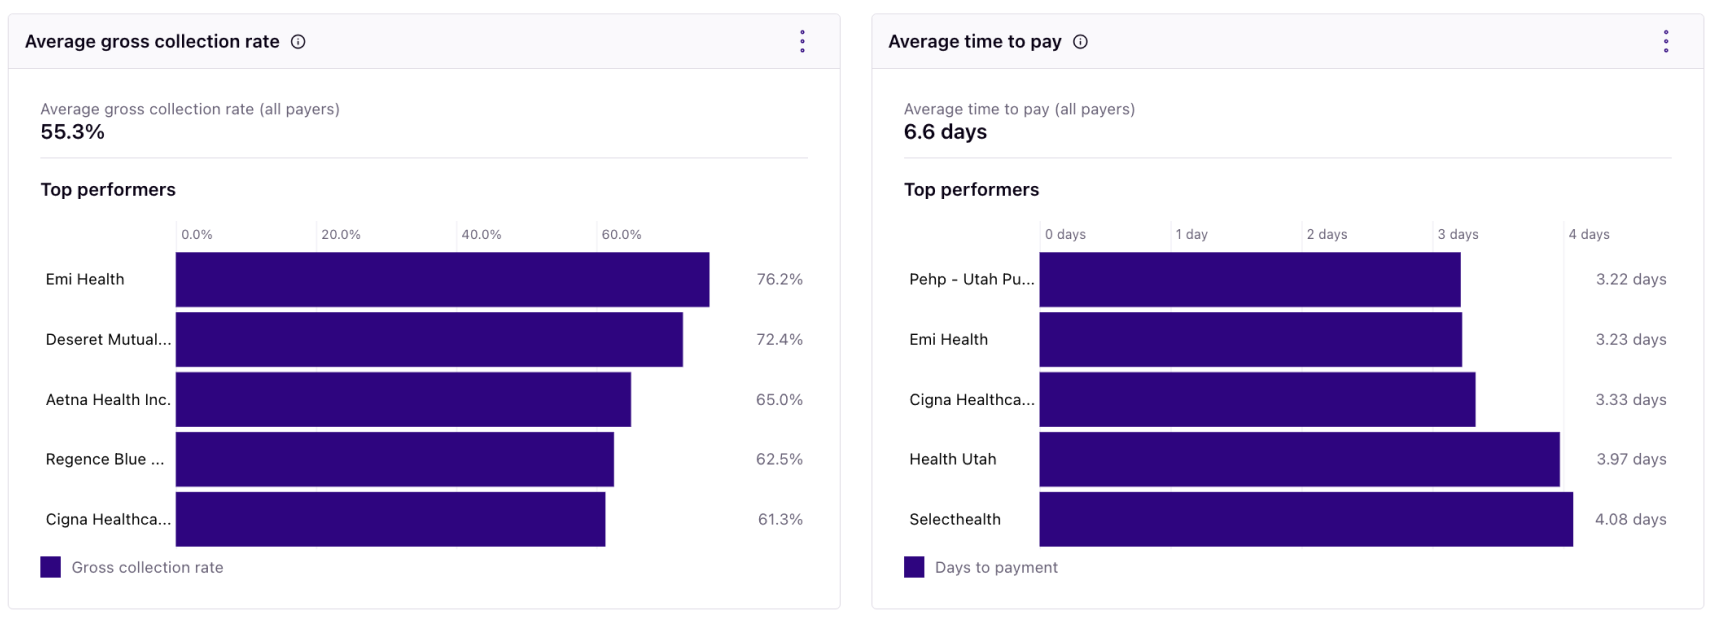
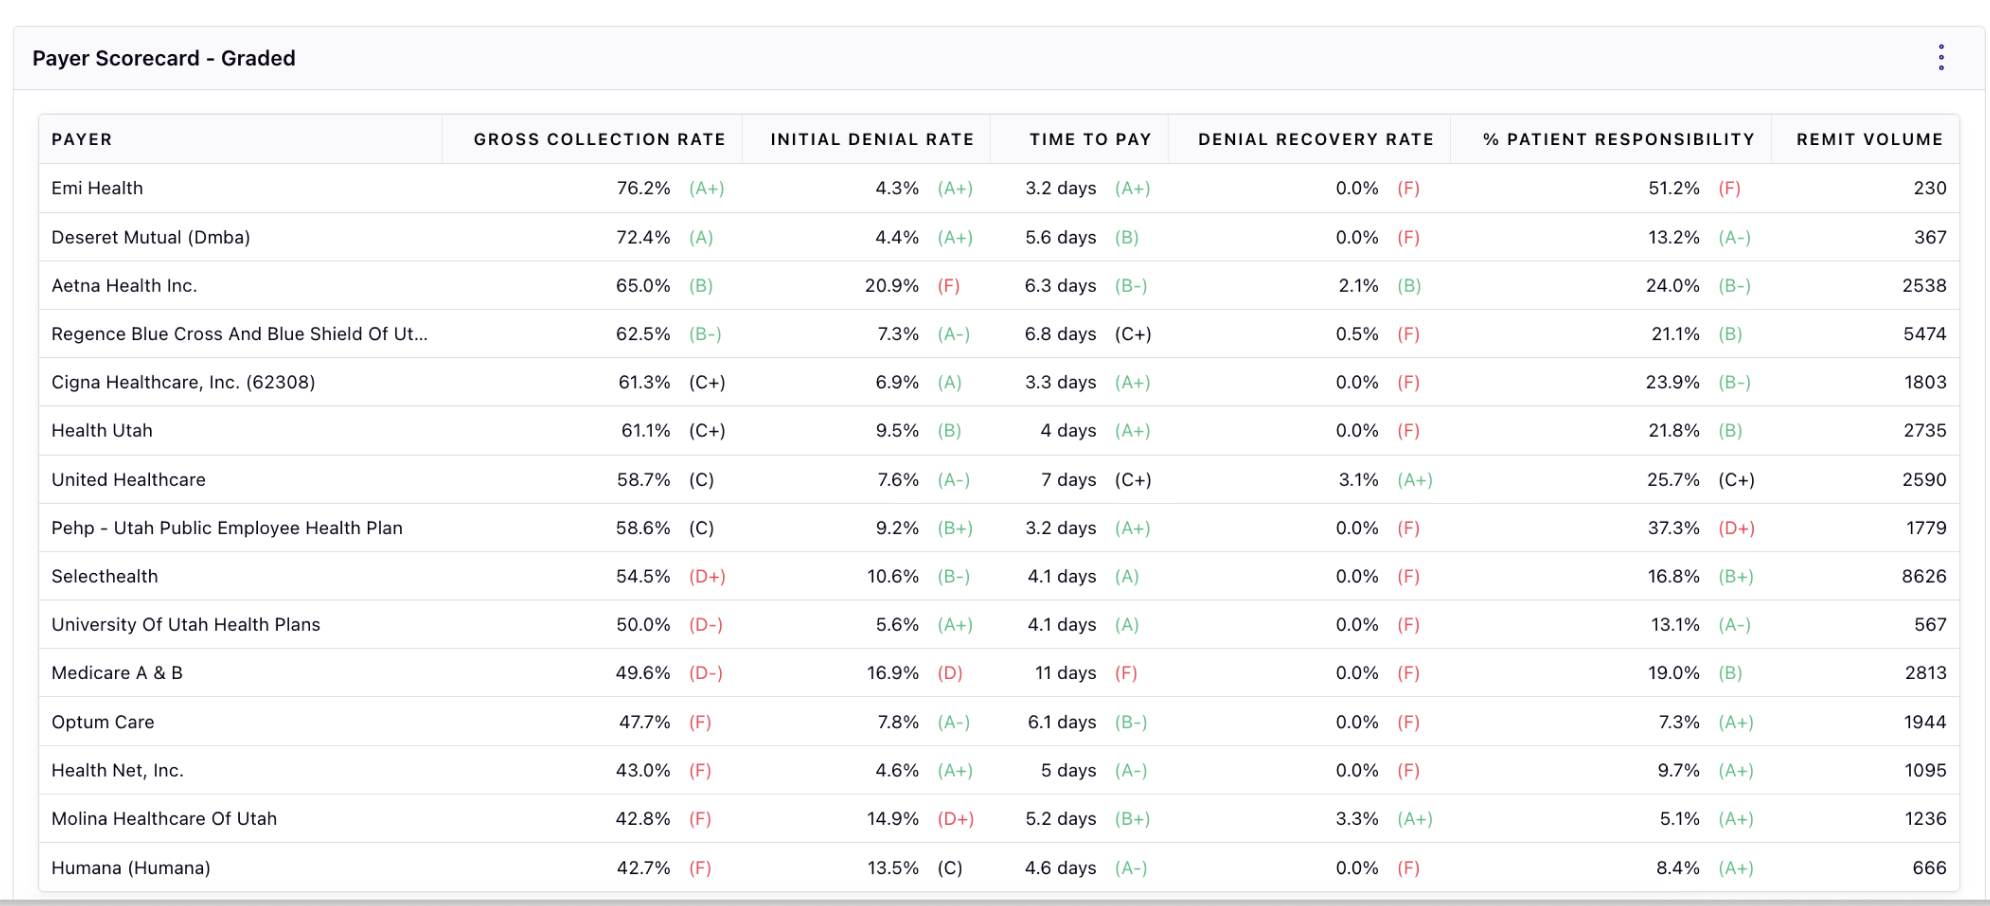
The Rivet Payers Report allows you to discover your payer mix, average gross collection rate by payer, average time to pay by payer, and how your payers compare to each other.

Jump into this data for ongoing metrics involving all of your insurance payers to prepare for contract negotiations. Manage your payer metrics for contract negotiations using these charts:

Screenshot 2024-07-15 at 12.18.52 PM
Stand up to insurance payers
Screenshot 2024-08-08 at 5.34.50 PM

Payer mix

  • Review your payer mix to see the segmentation of where your payer revenue derives.
  • Instantly gain insight into where negotiations need to occur, or possibly where you can cut ties.
Screenshot 2024-07-24 at 11.37.14 AM

Average gross collection rate + time to pay

  • Break down your average gross collection rate and time to pay by payer to get a deeper look at revenue.
  • Decide quickly which payer relationships need bolstering to adjust payer mix and improve reimbursement timelines.
Screenshot 2024-07-24 at 11.37.14 AM
Screenshot 2024-08-08 at 5.36.00 PM

Payer scoreboard

  • Compare payers with “scores” to quickly visualize what’s wrong with a specific payer relationship.
  • Use the worst scores to identify which contracts need negotiation and the criteria on which to focus attention.
Screenshot 2024-08-08 at 5.36.00 PM
Analyze. Act. Achieve.
These key insight reports cut analysis time to maximize time on strategic initiatives. What’s more, you can customize your visual analyses to dive into more granular information on every report. Filter by Coordination of Benefits (primary, secondary, tertiary +), payment issue, insurance payer, rendering provider, procedure code, facility, or add a new filter of your own.

Take hours of spreadsheet analysis off your calendar and make an impact in revenue immediately. All you need is Rivet’s one-stop reports to maximize revenue now and in the future.
Learn more
And that’s just the beginning of what you can do with Rivet Revenue Diagnostics
For further configuration and metrics to reliably project future revenue and model outcomes from potential strategic initiatives, consider Rivet Revenue Diagnostics forecasting to improve revenue cycle performance in a matter of moments. Rivet Revenue Diagnostics forecasting is a dynamic way to project revenue changes after acknowledging growth opportunities from Rivet’s instantaneous reimbursement reports.
Learn more about Revenue Diagnostics